- Introduction
- Security Observability vs Traditional Monitoring
- AWS CloudWatch and X-Ray: Strong but AWS-Locked
- OpenTelemetry: Traces, Metrics, and Logs Unified
- ADOT: AWS’s Own OpenTelemetry Distribution
- Security-Specific Instrumentation
- Deploying the ADOT Collector on EKS and Lambda
- Grafana for Security Dashboards
- Prometheus for Security Metrics Collection
- Comparison: CloudWatch vs OpenTelemetry + Grafana
- Security Use Cases
- Building Security Alerting Pipelines with OTel
- Implementation Roadmap
- Related Articles
- Conclusion
Introduction
Security teams have an observability problem. While DevOps engineers have spent years building sophisticated monitoring stacks for uptime and performance, security telemetry remains fragmented across disconnected tools, vendor-locked dashboards, and siloed alert streams. The result is a Mean Time to Detect (MTTD) that still hovers around 204 days for breach discovery and a Mean Time to Respond (MTTR) measured in weeks rather than minutes.
The observability gap in security is not a tooling problem – it is an architecture problem. Traditional security monitoring treats logs, metrics, and traces as separate concerns. A WAF logs blocked requests in one system. Authentication failures appear in another. API latency anomalies surface in a third. Correlating these signals to detect a coordinated attack requires manual investigation across multiple consoles, by which point the attacker has already moved laterally.
OpenTelemetry changes this equation. As a vendor-neutral, CNCF-graduated observability framework, it provides a single instrumentation layer that unifies traces, metrics, and logs into correlated telemetry. AWS recognized this shift so strongly that they built their own distribution – AWS Distro for OpenTelemetry (ADOT) – and are actively deprecating the legacy X-Ray SDKs in its favor.
This article demonstrates how to build a security observability pipeline using ADOT as the collection layer, with the freedom to export to CloudWatch for native integration or Grafana and Prometheus for vendor-neutral dashboards. The approach follows the red-team.sh philosophy: start with AWS-native, then layer open source for maximum flexibility and zero lock-in.
Current Landscape Statistics
- Breach Detection Time: Organizations take an average of 204 days to identify a breach and 73 days to contain it (IBM Cost of a Data Breach 2025)
- Observability Adoption: 85% of organizations now consider observability critical to their security posture, up from 62% in 2023
- OpenTelemetry Adoption: OTel is the second-most active CNCF project after Kubernetes, with contributions from AWS, Google, Microsoft, and 1,000+ organizations
- Cost Impact: Organizations with mature security observability reduce breach costs by an average of $1.76 million compared to those without
- ADOT Transition: AWS X-Ray SDKs entered maintenance mode on February 25, 2026, making ADOT the official path forward for distributed tracing on AWS
Security Observability vs Traditional Monitoring
Before diving into implementation, it is important to understand what separates security observability from the monitoring you already have in place. Traditional monitoring asks “is it up?” – security observability asks “is it compromised?”
Traditional Monitoring
Traditional monitoring focuses on availability and performance:
- Uptime checks: Is the service responding?
- Resource metrics: CPU, memory, disk, network utilization
- Error rates: HTTP 5xx counts, exception frequency
- Latency percentiles: p50, p95, p99 response times
- Throughput: Requests per second, transactions per minute
This data tells you whether your systems are healthy. It does not tell you whether an attacker is exfiltrating data through a series of seemingly normal API calls.
Security Observability
Security observability extends monitoring with threat-aware context:
- Authentication telemetry: Failed login patterns, credential stuffing velocity, impossible travel detection
- Authorization anomalies: Privilege escalation attempts, unusual role assumptions, cross-account access patterns
- API behavior analysis: Endpoint enumeration, parameter fuzzing, rate limit probing, unusual payload sizes
- Data flow tracing: Which identities accessed which data, through which services, at what volume
- Infrastructure mutation tracking: Security group changes, IAM policy modifications, encryption state changes
The key difference is correlation. A single failed login is noise. Fifty failed logins from rotating IPs against the same account, followed by a successful login from a new geography, followed by an API call to list all S3 buckets – that is a signal. Security observability makes this correlation possible by unifying all three telemetry pillars (traces, metrics, logs) under a common context.
AWS CloudWatch and X-Ray: Strong but AWS-Locked
AWS provides a comprehensive native observability stack. Before reaching for open source, it is worth understanding what CloudWatch and X-Ray deliver – and where they fall short.
What CloudWatch Does Well
- Zero-config integration with 70+ AWS services
- Logs Insights query language for ad-hoc investigation
- Contributor Insights for identifying top-N patterns (top IPs, top error codes)
- Anomaly Detection using machine learning on metric streams
- Cross-account observability through CloudWatch Organization sinks
- Metric Math for derived security metrics (error rate ratios, authentication failure velocity)
What X-Ray Does Well
- Distributed tracing across Lambda, ECS, EKS, and API Gateway
- Service maps that visualize request flow and identify bottlenecks
- Trace sampling that reduces cost while maintaining visibility
- Insights for automated anomaly detection on trace data
Where Native Falls Short
Vendor lock-in: CloudWatch metrics, logs, and X-Ray traces use proprietary formats. Moving to another cloud or a hybrid environment means rebuilding your entire observability pipeline.
Cost at scale: CloudWatch pricing compounds quickly. At $0.30 per custom metric per month, $0.50 per GB for log ingestion, and $0.01 per 1,000 GetMetricData API calls, a medium-sized security monitoring deployment can easily exceed $2,000/month in CloudWatch costs alone.
Limited correlation: While CloudWatch ServiceLens attempts to unify metrics, logs, and traces, the experience remains fragmented compared to a purpose-built observability platform like Grafana.
Dashboard limitations: CloudWatch dashboards lack the flexibility of Grafana for building complex security visualization panels with template variables, annotations, and cross-datasource correlation.
Retention costs: Long-term metric and log retention in CloudWatch is expensive. Security compliance often requires 1-7 years of retention, which can become a significant cost driver.
OpenTelemetry: Traces, Metrics, and Logs Unified
OpenTelemetry (OTel) is the vendor-neutral answer to the observability fragmentation problem. It provides a single set of APIs, SDKs, and protocols for generating, collecting, and exporting telemetry data.
The Three Pillars
Traces follow a request as it flows through distributed services. Each trace contains spans representing individual operations, with attributes that carry security-relevant context like user identity, source IP, and authorization decisions.
Metrics are numerical measurements collected at regular intervals. OTel supports counters, histograms, and gauges – the building blocks for security metrics like authentication failure rates, API abuse scores, and data transfer volumes.
Logs capture discrete events with structured attributes. OTel’s log data model standardizes log records across languages and frameworks, making it possible to correlate a log entry with the trace that generated it.
Why OTel Matters for Security
The real power of OpenTelemetry for security is context propagation. When a request enters your system, OTel generates a trace ID that follows it through every service, function, and database call. By enriching spans with security attributes (user ID, IP address, authentication method, authorization scope), you create a complete audit trail that can be queried, correlated, and alerted on.
This is fundamentally different from scraping CloudWatch logs after the fact. With OTel instrumentation, the security context is embedded in the telemetry at generation time, not reconstructed during investigation.
OTel Architecture
1
2
3
4
5
6
7
8
9
10
11
12
13
14
15
16
17
18
19
20
21
22
23
24
┌─────────────────────────────────────────────────────┐
│                  Application Code                    │
│  ┌──────────┐  ┌──────────┐  ┌──────────────────┐  │
│  │  Tracer   │  │  Meter   │  │  Logger           │  │
│  │  Provider │  │  Provider│  │  Provider         │  │
│  └─────┬────┘  └─────┬────┘  └────────┬─────────┘  │
│        │             │                │             │
│  ┌─────▼─────────────▼────────────────▼──────────┐  │
│  │            OTel SDK (Auto + Manual)            │  │
│  └──────────────────┬────────────────────────────┘  │
│                     │  OTLP Export                   │
└─────────────────────┼───────────────────────────────┘
                      │
              ┌───────▼───────┐
              │ ADOT Collector │
              │  (Receivers,   │
              │  Processors,   │
              │  Exporters)    │
              └───┬───┬───┬───┘
                  │   │   │
          ┌───────┘   │   └────────┐
          ▼           ▼            ▼
    CloudWatch   Prometheus    Jaeger
     + X-Ray     + Grafana
ADOT: AWS’s Own OpenTelemetry Distribution
AWS Distro for OpenTelemetry (ADOT) is AWS’s supported, production-ready distribution of the OpenTelemetry Collector and SDKs. It is not a fork – it is upstream OTel with AWS-specific receivers, processors, and exporters baked in.
Why ADOT Over Upstream OTel
- AWS-specific exporters: Native exporters for CloudWatch EMF (Embedded Metric Format), X-Ray traces, and CloudWatch Logs
- AWS resource detection: Automatic enrichment with EC2 instance metadata, EKS cluster info, Lambda function context
- Managed add-ons: Available as an EKS add-on, Lambda layer, and ECS sidecar with minimal configuration
- AWS support: Covered under AWS support plans, unlike community OTel builds
- Security patches: AWS backports security fixes and maintains release cadence aligned with upstream
ADOT Collector Components
The ADOT Collector follows the standard OTel Collector architecture:
Receivers ingest telemetry from applications and infrastructure:
otlp– Standard OTLP receiver for traces, metrics, and logsawsxray– Receives X-Ray formatted segmentsprometheus– Scrapes Prometheus-format metrics endpointsstatsd– Receives StatsD metrics
Processors transform and enrich telemetry:
batch– Batches data before export for efficiencyresourcedetection– Auto-detects AWS resource attributes (region, account, instance)filter– Drops or keeps telemetry based on attribute conditionsattributes– Adds, modifies, or removes span/metric attributes
Exporters send telemetry to backends:
awsxray– Exports traces to AWS X-Rayawsemf– Exports metrics as CloudWatch Embedded Metric Format logsawscloudwatchlogs– Exports logs to CloudWatch Logsprometheusremotewrite– Exports to Prometheus-compatible backends (including Amazon Managed Prometheus)otlp– Exports to any OTLP-compatible backend (Grafana Cloud, Jaeger, etc.)
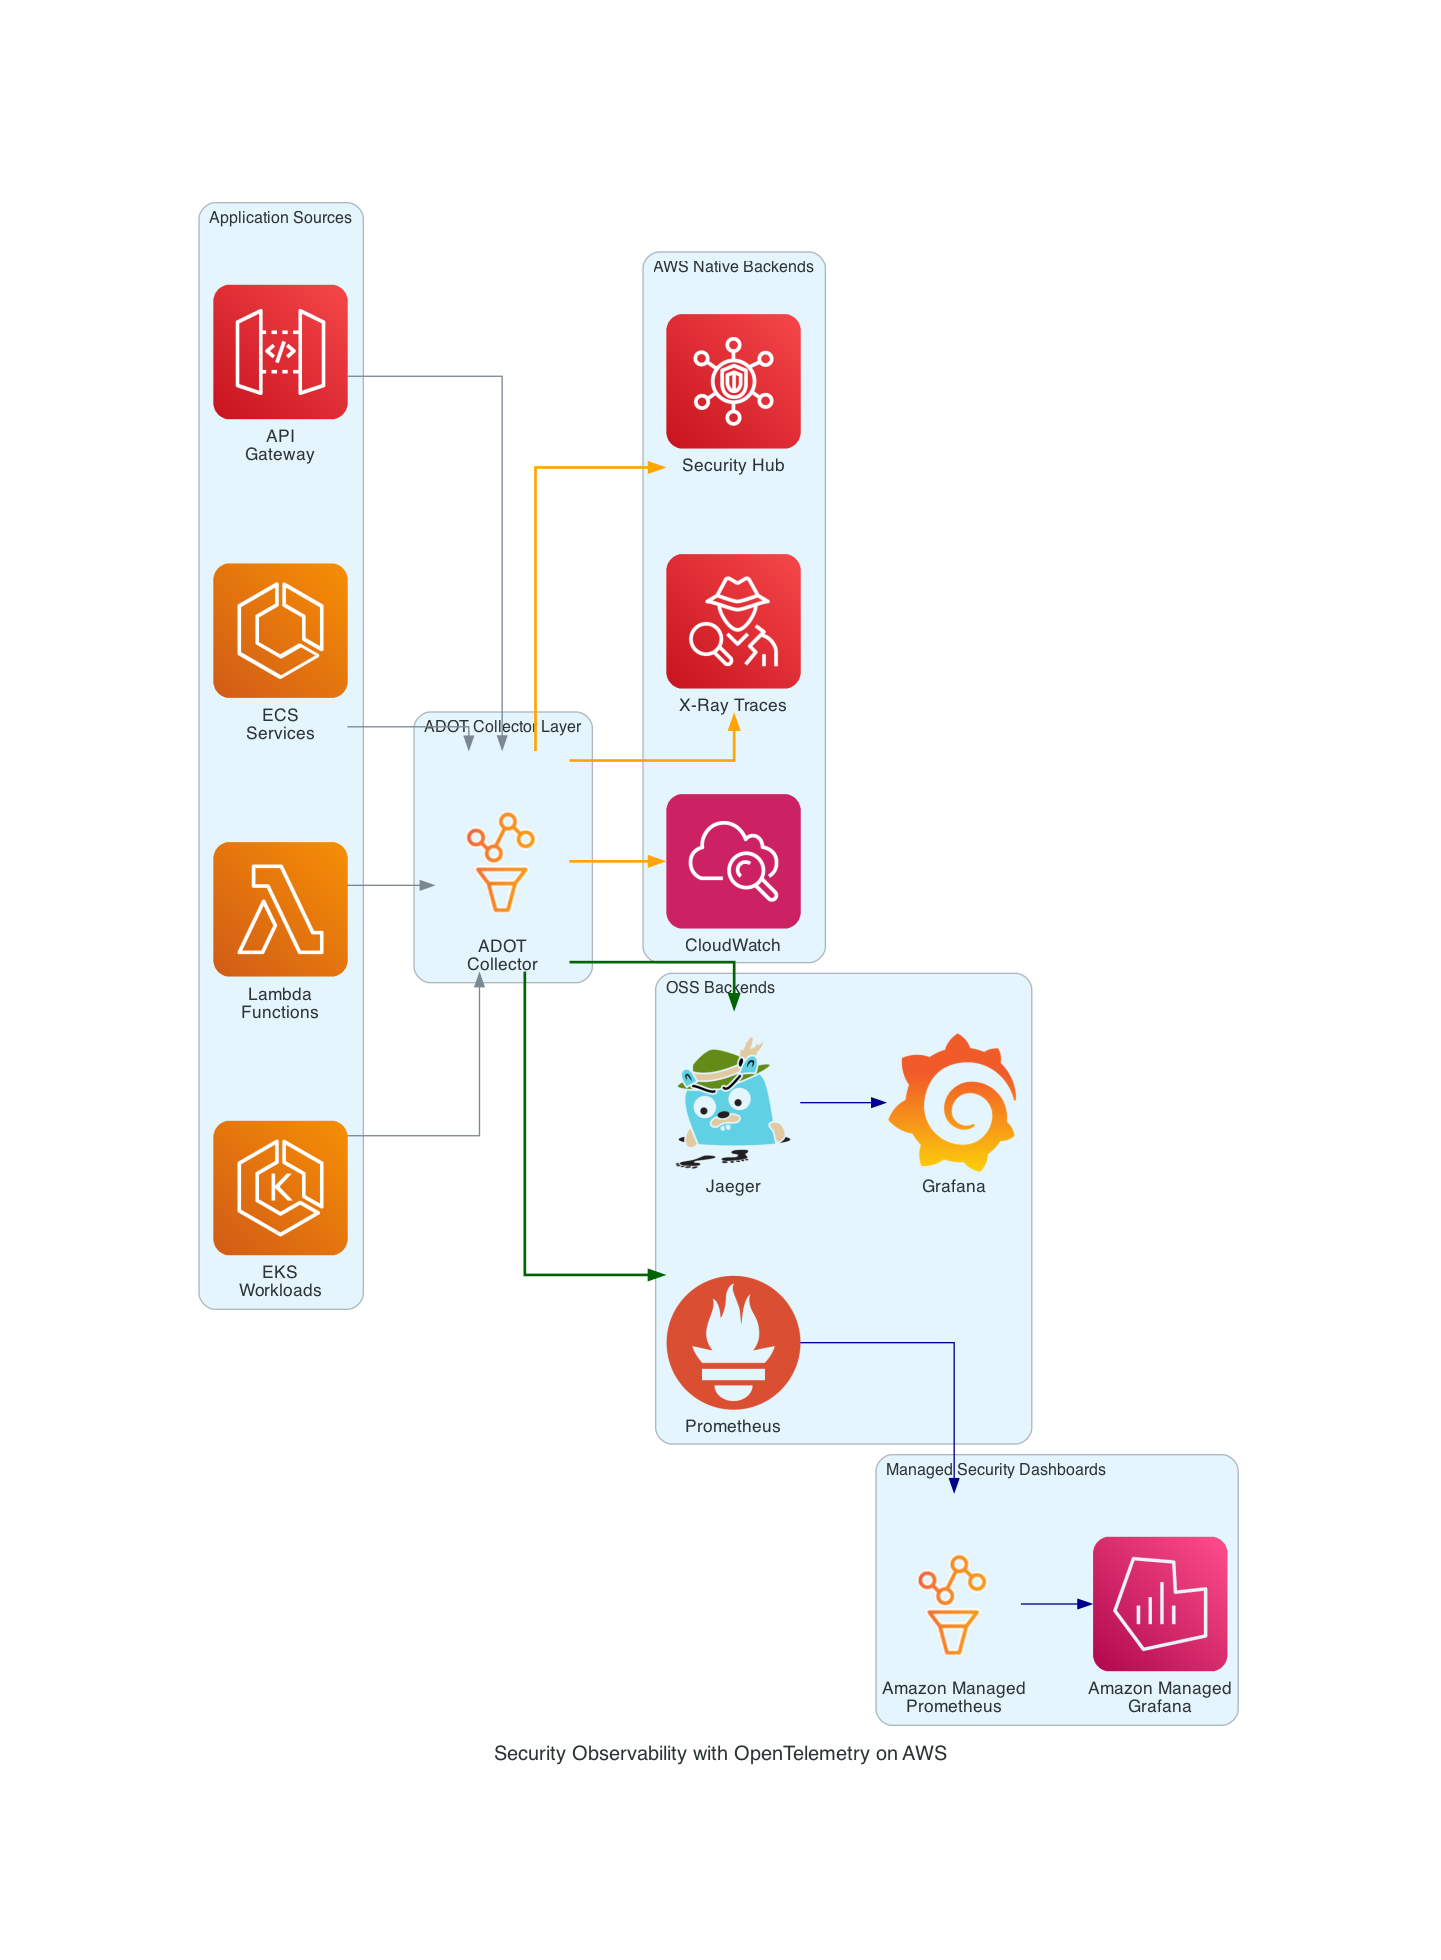 ADOT Collector routing telemetry to both AWS-native and OSS backends
Security-Specific Instrumentation
Generic observability instrumentation captures HTTP status codes and latency. Security observability requires intentional enrichment with threat-relevant attributes. Here is what to instrument and why.
Authentication Events
Every authentication attempt should generate a span with security attributes:
1
2
3
4
5
6
7
8
9
10
11
12
13
14
15
16
17
18
19
20
21
22
23
24
25
26
27
28
29
30
31
32
33
34
35
from opentelemetry import trace
from opentelemetry.trace import StatusCode
import hashlib

tracer = trace.get_tracer("auth-service")

def authenticate_user(request):
    with tracer.start_as_current_span("auth.authenticate") as span:
        # Security-relevant attributes
        span.set_attribute("auth.method", request.auth_method)  # "password", "mfa", "sso"
        span.set_attribute("auth.username", request.username)
        span.set_attribute("net.peer.ip", request.client_ip)
        span.set_attribute("http.user_agent", request.user_agent)
        span.set_attribute("auth.geo.country", geoip_lookup(request.client_ip))

        try:
            result = verify_credentials(request)
            span.set_attribute("auth.result", "success")
            span.set_attribute("auth.user_id", result.user_id)
            span.set_attribute("auth.roles", ",".join(result.roles))
            span.set_status(StatusCode.OK)
            return result

        except AuthenticationError as e:
            span.set_attribute("auth.result", "failure")
            span.set_attribute("auth.failure_reason", str(e))
            span.set_status(StatusCode.ERROR, str(e))

            # Increment security metric
            auth_failure_counter.add(1, {
                "auth.method": request.auth_method,
                "auth.failure_reason": str(e),
                "net.peer.ip": request.client_ip
            })
            raise
API Access Patterns
Track API access with enough detail to detect enumeration and abuse:
1
2
3
4
5
6
7
8
9
10
11
12
13
14
15
16
17
18
19
20
21
22
23
24
25
26
27
28
29
30
31
32
33
34
35
36
37
38
39
40
41
42
43
44
from opentelemetry import trace, metrics

meter = metrics.get_meter("api-security")
api_request_counter = meter.create_counter(
    "security.api.requests",
    description="API requests with security context"
)
api_payload_histogram = meter.create_histogram(
    "security.api.payload_size",
    description="Request payload sizes for anomaly detection",
    unit="bytes"
)

def security_middleware(request, call_next):
    span = trace.get_current_span()

    # Enrich with security context
    span.set_attribute("security.api.endpoint", request.path)
    span.set_attribute("security.api.method", request.method)
    span.set_attribute("security.api.authenticated", bool(request.user))
    span.set_attribute("security.api.user_id", getattr(request.user, "id", "anonymous"))
    span.set_attribute("security.api.source_ip", request.client.host)
    span.set_attribute("security.api.request_size", len(request.body or b""))

    # Track payload sizes for data exfiltration detection
    api_payload_histogram.record(
        len(request.body or b""),
        {"endpoint": request.path, "method": request.method}
    )

    response = call_next(request)

    span.set_attribute("security.api.response_size", response.content_length or 0)
    span.set_attribute("security.api.status_code", response.status_code)

    # Record security metric
    api_request_counter.add(1, {
        "endpoint": request.path,
        "method": request.method,
        "status": str(response.status_code),
        "authenticated": str(bool(request.user))
    })

    return response
IAM and Authorization Events
1
2
3
4
5
6
7
8
9
10
11
12
13
14
15
16
17
18
19
def check_authorization(user, resource, action):
    with tracer.start_as_current_span("authz.check") as span:
        span.set_attribute("authz.user_id", user.id)
        span.set_attribute("authz.resource", resource)
        span.set_attribute("authz.action", action)
        span.set_attribute("authz.roles", ",".join(user.roles))

        allowed = policy_engine.evaluate(user, resource, action)

        span.set_attribute("authz.decision", "allow" if allowed else "deny")

        if not allowed:
            authz_denial_counter.add(1, {
                "user_id": user.id,
                "resource": resource,
                "action": action
            })

        return allowed
Deploying the ADOT Collector on EKS and Lambda
ADOT Collector Configuration for Security Telemetry
The following ADOT Collector configuration receives OTLP telemetry, enriches it with AWS resource attributes, and dual-exports to both CloudWatch/X-Ray and Prometheus/Grafana:
1
2
3
4
5
6
7
8
9
10
11
12
13
14
15
16
17
18
19
20
21
22
23
24
25
26
27
28
29
30
31
32
33
34
35
36
37
38
39
40
41
42
43
44
45
46
47
48
49
50
51
52
53
54
55
56
57
58
59
60
61
62
63
64
65
66
67
68
69
70
71
72
73
74
75
76
77
78
79
80
81
82
83
84
85
86
87
88
89
90
91
92
93
94
95
96
97
98
99
100
101
102
103
104
105
106
107
108
109
110
111
112
113
114
115
116
117
118
119
120
121
122
123
124
125
126
127
128
129
# adot-collector-config.yaml
receivers:
  otlp:
    protocols:
      grpc:
        endpoint: 0.0.0.0:4317
      http:
        endpoint: 0.0.0.0:4318

  # Scrape Prometheus metrics from application security endpoints
  prometheus:
    config:
      scrape_configs:
        - job_name: "security-metrics"
          scrape_interval: 15s
          kubernetes_sd_configs:
            - role: pod
          relabel_configs:
            - source_labels: [__meta_kubernetes_pod_annotation_prometheus_io_scrape]
              action: keep
              regex: true
            - source_labels: [__meta_kubernetes_pod_annotation_prometheus_io_path]
              action: replace
              target_label: __metrics_path__
              regex: (.+)

processors:
  batch:
    timeout: 10s
    send_batch_size: 1024

  # Auto-detect AWS resource attributes
  resourcedetection:
    detectors: [eks, ec2, env]
    timeout: 5s
    override: false

  # Add security classification attributes
  attributes/security:
    actions:
      - key: telemetry.domain
        value: security
        action: upsert
      - key: environment
        from_attribute: ENVIRONMENT
        action: upsert

  # Filter to separate security telemetry from general telemetry
  filter/security_traces:
    traces:
      span:
        - 'attributes["security.api.endpoint"] != nil'
        - 'name == "auth.authenticate"'
        - 'name == "authz.check"'

  # Memory limiter to prevent OOM
  memory_limiter:
    check_interval: 5s
    limit_mib: 512
    spike_limit_mib: 128

exporters:
  # AWS X-Ray for distributed tracing
  awsxray:
    region: us-east-1
    indexed_attributes:
      - "auth.result"
      - "auth.username"
      - "security.api.endpoint"

  # CloudWatch EMF for metrics
  awsemf:
    region: us-east-1
    namespace: "SecurityObservability"
    log_group_name: "/security/otel/metrics"
    dimension_rollup_option: "NoDimensionRollup"
    metric_declarations:
      - dimensions:
          - ["auth.method", "auth.result"]
          - ["security.api.endpoint", "security.api.method"]
        metric_name_selectors:
          - "security.*"

  # Amazon Managed Prometheus for long-term metric storage
  prometheusremotewrite:
    endpoint: "https://aps-workspaces.us-east-1.amazonaws.com/workspaces/ws-XXXX/api/v1/remote_write"
    auth:
      authenticator: sigv4auth
    resource_to_telemetry_conversion:
      enabled: true

  # OTLP export to Grafana for unified dashboards
  otlp/grafana:
    endpoint: "grafana-agent.monitoring.svc.cluster.local:4317"
    tls:
      insecure: false
      ca_file: /etc/ssl/certs/ca-certificates.crt

  # CloudWatch Logs for security event logs
  awscloudwatchlogs:
    region: us-east-1
    log_group_name: "/security/otel/logs"
    log_stream_name: "security-events"

extensions:
  sigv4auth:
    region: us-east-1
    service: aps

  health_check:
    endpoint: 0.0.0.0:13133

service:
  extensions: [sigv4auth, health_check]
  pipelines:
    traces:
      receivers: [otlp]
      processors: [memory_limiter, resourcedetection, attributes/security, batch]
      exporters: [awsxray, otlp/grafana]

    metrics:
      receivers: [otlp, prometheus]
      processors: [memory_limiter, resourcedetection, attributes/security, batch]
      exporters: [awsemf, prometheusremotewrite]

    logs:
      receivers: [otlp]
      processors: [memory_limiter, resourcedetection, attributes/security, batch]
      exporters: [awscloudwatchlogs, otlp/grafana]
Kubernetes Deployment for ADOT Collector
Deploy the ADOT Collector as a DaemonSet on EKS for node-level collection, or as a Deployment for centralized collection:
1
2
3
4
5
6
7
8
9
10
11
12
13
14
15
16
17
18
19
20
21
22
23
24
25
26
27
28
29
30
31
32
33
34
35
36
37
38
39
40
41
42
43
44
45
46
47
48
49
50
51
52
53
54
55
56
57
58
59
60
61
62
63
64
65
66
67
68
69
70
71
72
73
74
75
76
77
78
79
80
81
82
83
84
85
# adot-collector-deployment.yaml
apiVersion: apps/v1
kind: Deployment
metadata:
  name: adot-security-collector
  namespace: monitoring
  labels:
    app: adot-security-collector
spec:
  replicas: 2
  selector:
    matchLabels:
      app: adot-security-collector
  template:
    metadata:
      labels:
        app: adot-security-collector
    spec:
      serviceAccountName: adot-collector-sa
      containers:
        - name: adot-collector
          image: public.ecr.aws/aws-observability/aws-otel-collector:v0.47.0
          ports:
            - containerPort: 4317  # OTLP gRPC
              name: otlp-grpc
            - containerPort: 4318  # OTLP HTTP
              name: otlp-http
            - containerPort: 13133 # Health check
              name: health
          resources:
            requests:
              cpu: 250m
              memory: 512Mi
            limits:
              cpu: 1000m
              memory: 1Gi
          volumeMounts:
            - name: config
              mountPath: /etc/otel
          env:
            - name: ENVIRONMENT
              valueFrom:
                fieldRef:
                  fieldPath: metadata.namespace
          livenessProbe:
            httpGet:
              path: /
              port: health
            initialDelaySeconds: 15
            periodSeconds: 10
          readinessProbe:
            httpGet:
              path: /
              port: health
            initialDelaySeconds: 5
            periodSeconds: 5
      volumes:
        - name: config
          configMap:
            name: adot-security-config
---
apiVersion: v1
kind: Service
metadata:
  name: adot-security-collector
  namespace: monitoring
spec:
  selector:
    app: adot-security-collector
  ports:
    - name: otlp-grpc
      port: 4317
      targetPort: 4317
    - name: otlp-http
      port: 4318
      targetPort: 4318
  type: ClusterIP
---
apiVersion: v1
kind: ServiceAccount
metadata:
  name: adot-collector-sa
  namespace: monitoring
  annotations:
    eks.amazonaws.com/role-arn: arn:aws:iam::ACCOUNT_ID:role/ADOTCollectorRole
Lambda Layer Configuration for ADOT
For Lambda-based workloads, ADOT ships as a managed Lambda layer:
1
2
3
4
5
6
7
8
9
10
11
12
13
14
15
16
17
18
19
20
21
22
23
24
25
26
27
28
29
30
31
32
33
34
35
36
37
38
39
40
# template.yaml (AWS SAM)
AWSTemplateFormatVersion: "2010-09-09"
Transform: AWS::Serverless-2016-10-31

Globals:
  Function:
    Runtime: python3.12
    Timeout: 30
    MemorySize: 512
    Tracing: Active
    Environment:
      Variables:
        AWS_LAMBDA_EXEC_WRAPPER: /opt/otel-instrument
        OPENTELEMETRY_COLLECTOR_CONFIG_FILE: /var/task/collector.yaml
        OTEL_SERVICE_NAME: security-api
        OTEL_RESOURCE_ATTRIBUTES: "deployment.environment=production"
    Layers:
      # ADOT Lambda Layer for Python
      - !Sub "arn:aws:lambda:${AWS::Region}:901920570463:layer:aws-otel-python-amd64-ver-1-25-0:1"

Resources:
  SecurityApiFunction:
    Type: AWS::Serverless::Function
    Properties:
      Handler: app.handler
      CodeUri: src/
      Description: Security API with ADOT instrumentation
      Policies:
        - AWSXRayDaemonWriteAccess
        - Statement:
            - Effect: Allow
              Action:
                - "aps:RemoteWrite"
              Resource: "*"
      Events:
        ApiEvent:
          Type: Api
          Properties:
            Path: /api/{proxy+}
            Method: ANY
Grafana for Security Dashboards
Grafana transforms raw security telemetry into actionable dashboards. Whether you run self-hosted Grafana on ECS or use Amazon Managed Grafana (AMG), the dashboard definitions are identical.
Terraform for Grafana on ECS Fargate
1
2
3
4
5
6
7
8
9
10
11
12
13
14
15
16
17
18
19
20
21
22
23
24
25
26
27
28
29
30
31
32
33
34
35
36
37
38
39
40
41
42
43
44
45
46
47
48
49
50
51
52
53
54
55
56
57
58
59
60
61
62
63
64
65
66
67
68
69
70
71
72
73
74
75
76
77
78
79
80
81
82
83
84
85
86
87
88
89
90
91
92
93
94
95
96
97
98
99
100
101
102
103
104
105
106
107
108
109
110
# grafana.tf
resource "aws_ecs_cluster" "monitoring" {
  name = "security-monitoring"

  setting {
    name  = "containerInsights"
    value = "enabled"
  }

  tags = {
    Customer    = "red-team"
    Application = "security-observability"
    Environment = "production"
    Owner       = "jon"
    Costcenter  = "security"
  }
}

resource "aws_ecs_task_definition" "grafana" {
  family                   = "grafana-security"
  network_mode             = "awsvpc"
  requires_compatibilities = ["FARGATE"]
  cpu                      = "1024"
  memory                   = "2048"
  execution_role_arn       = aws_iam_role.ecs_execution.arn
  task_role_arn            = aws_iam_role.grafana_task.arn

  container_definitions = jsonencode([
    {
      name  = "grafana"
      image = "grafana/grafana-oss:12.0.0"
      portMappings = [
        {
          containerPort = 3000
          protocol      = "tcp"
        }
      ]
      environment = [
        { name = "GF_SECURITY_ADMIN_PASSWORD", value = "CHANGE_ME" },
        { name = "GF_INSTALL_PLUGINS", value = "grafana-clock-panel,grafana-piechart-panel" },
        { name = "GF_AUTH_ANONYMOUS_ENABLED", value = "false" },
        { name = "GF_SECURITY_ALLOW_EMBEDDING", value = "false" },
        { name = "GF_SECURITY_COOKIE_SECURE", value = "true" },
        { name = "GF_SECURITY_STRICT_TRANSPORT_SECURITY", value = "true" }
      ]
      logConfiguration = {
        logDriver = "awslogs"
        options = {
          "awslogs-group"         = "/ecs/grafana-security"
          "awslogs-region"        = "us-east-1"
          "awslogs-stream-prefix" = "grafana"
        }
      }
      mountPoints = [
        {
          sourceVolume  = "grafana-data"
          containerPath = "/var/lib/grafana"
        }
      ]
    }
  ])

  volume {
    name = "grafana-data"
    efs_volume_configuration {
      file_system_id = aws_efs_file_system.grafana.id
    }
  }

  tags = {
    Customer    = "red-team"
    Application = "security-observability"
    Environment = "production"
    Owner       = "jon"
    Costcenter  = "security"
  }
}

resource "aws_ecs_service" "grafana" {
  name            = "grafana-security"
  cluster         = aws_ecs_cluster.monitoring.id
  task_definition = aws_ecs_task_definition.grafana.arn
  desired_count   = 1
  launch_type     = "FARGATE"

  network_configuration {
    subnets          = var.private_subnet_ids
    security_groups  = [aws_security_group.grafana.id]
    assign_public_ip = false
  }

  load_balancer {
    target_group_arn = aws_lb_target_group.grafana.arn
    container_name   = "grafana"
    container_port   = 3000
  }
}

resource "aws_efs_file_system" "grafana" {
  creation_token = "grafana-security-data"
  encrypted      = true

  tags = {
    Customer    = "red-team"
    Application = "security-observability"
    Environment = "production"
    Owner       = "jon"
    Costcenter  = "security"
  }
}
Grafana Dashboard JSON for Security Metrics
The following dashboard provides a security operations overview with authentication monitoring, API abuse detection, and authorization anomaly panels:
1
2
3
4
5
6
7
8
9
10
11
12
13
14
15
16
17
18
19
20
21
22
23
24
25
26
27
28
29
30
31
32
33
34
35
36
37
38
39
40
41
42
43
44
45
46
47
48
49
50
51
52
53
54
55
56
57
58
59
60
61
62
63
64
65
66
67
68
69
70
71
72
73
74
75
76
77
78
79
80
81
82
83
84
85
86
87
88
89
90
91
92
93
94
95
96
97
98
99
100
101
102
103
104
105
106
107
108
109
110
111
112
113
{
  "dashboard": {
    "title": "Security Observability - OTel",
    "tags": ["security", "opentelemetry", "adot"],
    "timezone": "browser",
    "panels": [
      {
        "title": "Authentication Failures (15m rolling)",
        "type": "timeseries",
        "gridPos": { "h": 8, "w": 12, "x": 0, "y": 0 },
        "targets": [
          {
            "expr": "sum(rate(security_auth_failures_total[15m])) by (auth_method, failure_reason)",
            "legendFormat": " - "
          }
        ],
        "fieldConfig": {
          "defaults": {
            "custom": {
              "drawStyle": "line",
              "fillOpacity": 20,
              "lineWidth": 2
            },
            "thresholds": {
              "steps": [
                { "color": "green", "value": null },
                { "color": "yellow", "value": 10 },
                { "color": "red", "value": 50 }
              ]
            }
          }
        }
      },
      {
        "title": "API Request Anomalies",
        "type": "timeseries",
        "gridPos": { "h": 8, "w": 12, "x": 12, "y": 0 },
        "targets": [
          {
            "expr": "sum(rate(security_api_requests_total{status=~\"4..\"}[5m])) by (endpoint)",
            "legendFormat": "4xx: "
          },
          {
            "expr": "histogram_quantile(0.99, rate(security_api_payload_size_bytes_bucket[5m]))",
            "legendFormat": "p99 payload size"
          }
        ]
      },
      {
        "title": "Authorization Denials by Resource",
        "type": "barchart",
        "gridPos": { "h": 8, "w": 12, "x": 0, "y": 8 },
        "targets": [
          {
            "expr": "topk(10, sum(increase(security_authz_denials_total[1h])) by (resource, action))",
            "legendFormat": " / "
          }
        ]
      },
      {
        "title": "Top Source IPs by Failed Auth",
        "type": "table",
        "gridPos": { "h": 8, "w": 12, "x": 12, "y": 8 },
        "targets": [
          {
            "expr": "topk(20, sum(increase(security_auth_failures_total[1h])) by (source_ip))",
            "format": "table",
            "instant": true
          }
        ]
      },
      {
        "title": "Security Event Rate (All Types)",
        "type": "stat",
        "gridPos": { "h": 4, "w": 6, "x": 0, "y": 16 },
        "targets": [
          {
            "expr": "sum(rate(security_events_total[5m]))",
            "legendFormat": "events/sec"
          }
        ]
      },
      {
        "title": "Unique Source IPs (1h)",
        "type": "stat",
        "gridPos": { "h": 4, "w": 6, "x": 6, "y": 16 },
        "targets": [
          {
            "expr": "count(count by (source_ip)(security_api_requests_total))",
            "legendFormat": "unique IPs"
          }
        ]
      }
    ],
    "templating": {
      "list": [
        {
          "name": "environment",
          "type": "query",
          "query": "label_values(security_api_requests_total, environment)",
          "current": { "text": "production", "value": "production" }
        },
        {
          "name": "service",
          "type": "query",
          "query": "label_values(security_api_requests_total, service_name)"
        }
      ]
    },
    "time": { "from": "now-6h", "to": "now" },
    "refresh": "30s"
  }
}
Prometheus for Security Metrics Collection
Prometheus serves as the metrics backbone for security observability. When paired with ADOT’s prometheusremotewrite exporter and Amazon Managed Prometheus (AMP) for storage, you get durable, queryable security metrics without managing Prometheus infrastructure.
Prometheus Alerting Rules for Security Events
1
2
3
4
5
6
7
8
9
10
11
12
13
14
15
16
17
18
19
20
21
22
23
24
25
26
27
28
29
30
31
32
33
34
35
36
37
38
39
40
41
42
43
44
45
46
47
48
49
50
51
52
53
54
55
56
57
58
59
60
61
62
63
64
65
66
67
68
69
70
71
72
73
74
75
76
77
78
79
80
81
82
83
84
85
86
87
88
89
90
91
92
93
94
# security-alerts.yaml
groups:
  - name: authentication_security
    interval: 30s
    rules:
      # Credential stuffing detection
      - alert: HighAuthFailureRate
        expr: |
          sum(rate(security_auth_failures_total[5m])) > 10
        for: 2m
        labels:
          severity: warning
          team: security
        annotations:
          summary: "High authentication failure rate detected"
          description: "Authentication failures exceeding 10/sec for 2 minutes. Possible credential stuffing attack."
          runbook_url: "https://wiki.internal/runbooks/credential-stuffing"

      # Brute force detection per IP
      - alert: BruteForceAttempt
        expr: |
          sum(rate(security_auth_failures_total[5m])) by (source_ip) > 5
        for: 1m
        labels:
          severity: critical
          team: security
        annotations:
          summary: "Brute force attempt from "
          description: "Single IP  generating >5 auth failures/sec."

      # Impossible travel detection
      - alert: ImpossibleTravel
        expr: |
          count(
            count by (user_id, geo_country)(
              security_auth_success_total
            )
          ) by (user_id) > 2
          and
          sum(rate(security_auth_success_total[30m])) by (user_id) > 0
        for: 1m
        labels:
          severity: critical
          team: security
        annotations:
          summary: "Impossible travel detected for user "
          description: "User authenticating from multiple countries within 30 minutes."

  - name: api_security
    interval: 30s
    rules:
      # API enumeration detection
      - alert: APIEnumeration
        expr: |
          count(
            count by (source_ip, endpoint)(
              rate(security_api_requests_total{status="404"}[5m]) > 0
            )
          ) by (source_ip) > 20
        for: 2m
        labels:
          severity: warning
          team: security
        annotations:
          summary: "API enumeration detected from "
          description: "IP hitting >20 unique 404 endpoints in 5 minutes."

      # Data exfiltration detection
      - alert: AnomalousDataTransfer
        expr: |
          histogram_quantile(0.99, rate(security_api_payload_size_bytes_bucket[5m]))
          > 10 * histogram_quantile(0.99, rate(security_api_payload_size_bytes_bucket[1h]))
        for: 5m
        labels:
          severity: critical
          team: security
        annotations:
          summary: "Anomalous data transfer detected"
          description: "Response payload sizes 10x above normal p99 baseline."

  - name: authorization_security
    interval: 30s
    rules:
      # Privilege escalation attempts
      - alert: PrivilegeEscalationAttempt
        expr: |
          sum(rate(security_authz_denials_total{action=~"admin.*|delete.*|modify_policy.*"}[5m])) by (user_id) > 3
        for: 1m
        labels:
          severity: critical
          team: security
        annotations:
          summary: "Privilege escalation attempts by "
          description: "User repeatedly denied access to privileged operations."
Comparison: CloudWatch vs OpenTelemetry + Grafana
| Feature | CloudWatch + X-Ray | ADOT + Prometheus + Grafana |
|---|---|---|
| Setup Complexity | Low – native integration | Medium – collector deployment required |
| Vendor Lock-in | High – proprietary formats | None – OTLP is an open standard |
| Multi-Cloud Support | AWS only | Any cloud or on-prem |
| Cost (100 services, moderate traffic) | $1,500-3,000/mo | $400-1,200/mo (self-managed) |
| Cost (managed) | Included above | $800-1,800/mo (AMP + AMG) |
| Custom Metrics | $0.30/metric/month | Free (self-hosted Prometheus) |
| Log Ingestion | $0.50/GB | Varies by backend ($0.10-0.30/GB typical) |
| Dashboard Flexibility | Limited | Extensive (Grafana panels, variables, annotations) |
| Alerting | CloudWatch Alarms (basic) | Grafana Alerting + AlertManager (advanced) |
| Trace Sampling | Fixed rate | Head/tail/probabilistic sampling |
| Data Retention | 15 months (metrics), configurable (logs) | Unlimited (your storage) |
| Correlation | ServiceLens (limited) | Grafana Explore (traces + logs + metrics) |
| Security Compliance | SOC2, HIPAA, FedRAMP built-in | Self-managed compliance |
| Operational Overhead | None – fully managed | Medium – collector and backend management |
| Community Dashboards | Limited | 1,000+ community dashboards on grafana.com |
When to Use Each
Choose CloudWatch + X-Ray when:
- Your workloads are 100% AWS and will stay that way
- Your team lacks the capacity to manage observability infrastructure
- You need FedRAMP/HIPAA compliance out of the box
- Your telemetry volume is small enough that CloudWatch costs are reasonable
Choose ADOT + Grafana when:
- You operate in multi-cloud or hybrid environments
- You want vendor-neutral telemetry that survives a cloud migration
- CloudWatch costs are growing faster than your budget
- You need advanced visualization, correlation, and alerting
- Your security team requires custom dashboards beyond what CloudWatch offers
The sweet spot: Use ADOT as the collection layer and export to both. Send traces to X-Ray for AWS console integration and simultaneously to Grafana for advanced analysis. Send metrics to both CloudWatch (for native alarms) and Prometheus (for Grafana dashboards). This dual-export approach gives you the best of both worlds at minimal additional cost.
Security Use Cases
API Abuse Detection
API abuse often manifests as patterns invisible to traditional monitoring. By instrumenting with OTel, you can detect:
Credential stuffing: High-velocity authentication failures from distributed IP ranges. The authentication span attributes (auth.result, net.peer.ip, auth.method) feed Prometheus metrics that trigger alerts when failure rates exceed baseline.
Endpoint enumeration: Attackers probe for undocumented API endpoints. Tracking 404 responses by source IP and correlating with the total unique endpoints hit reveals scanning behavior that per-endpoint monitoring misses.
Rate limit evasion: Sophisticated attackers rotate through multiple API keys or source IPs to stay under per-client rate limits. By aggregating request patterns across all identifiers at the OTel Collector level, you can detect distributed abuse that no single rate limiter would catch.
Authentication Anomaly Detection
Authentication telemetry collected through OTel enables several detection patterns:
Impossible travel: When a user authenticates from New York and then from Tokyo 30 minutes later, the geographic attributes on authentication spans make this trivially detectable. The Prometheus alert rule shown earlier implements this pattern.
Credential reuse across accounts: By hashing and comparing authentication attempt patterns (same password hash across different usernames from the same IP), you can identify credential reuse attacks that would otherwise appear as unrelated failed logins.
Session anomalies: Track session creation, renewal, and usage patterns. A session that suddenly starts accessing resources outside its historical pattern may indicate session hijacking.
Latency-Based Threat Detection
This is where security observability truly differentiates from traditional monitoring. Certain attacks create subtle latency signatures:
SQL injection probing: Injected SQL payloads that trigger error-path processing often exhibit different latency profiles than normal queries. By tracking database span duration distributions and alerting on shifts in the p99, you can detect injection attempts before the WAF catches the payload.
Timing side channels: Authentication endpoints that take longer to reject valid usernames than invalid ones leak information. OTel trace data makes these timing differences visible and alertable.
Cryptomining detection: Compromised containers running cryptominers exhibit characteristic CPU utilization patterns that diverge from their historical baseline. Prometheus metrics collected via OTel surface these anomalies.
Building Security Alerting Pipelines with OTel
The complete alerting pipeline connects OTel instrumentation to incident response:
1
2
3
4
5
6
7
8
9
10
11
12
13
14
15
16
17
18
19
20
21
22
23
Application Instrumentation (OTel SDK)
    │
    ▼
ADOT Collector (filter, enrich, batch)
    │
    ├──► Amazon Managed Prometheus (metrics storage)
    │        │
    │        ▼
    │    Prometheus AlertManager / Grafana Alerting
    │        │
    │        ├──► SNS Topic (arn:aws:sns:us-east-1:...:alert-critical)
    │        ├──► PagerDuty / Opsgenie
    │        └──► Slack #security-alerts
    │
    ├──► CloudWatch Logs (log storage)
    │        │
    │        ▼
    │    CloudWatch Alarm → Lambda → Security Hub Finding
    │
    └──► Grafana (visualization + investigation)
             │
             ▼
         Security Analyst Investigation Workflow
Connecting Grafana Alerting to AWS SNS
1
2
3
4
5
6
7
8
9
10
11
12
13
14
15
16
17
18
19
20
21
22
23
24
25
# grafana-alerting-contact-points.yaml
apiVersion: 1
contactPoints:
  - orgId: 1
    name: security-critical
    receivers:
      - uid: sns-critical
        type: sns
        settings:
          topic: "arn:aws:sns:us-east-1:181303648587:alert-critical"
          authProvider: default
        disableResolveMessage: false
      - uid: slack-security
        type: slack
        settings:
          url: "${SLACK_WEBHOOK_URL}"
          recipient: "#security-alerts"
          title: |
            []
          text: |

            *Summary*:
            *Description*:
            *Severity*:
Lambda Function for Security Hub Integration
When a Prometheus alert fires, you can create a Security Hub finding to centralize security events:
1
2
3
4
5
6
7
8
9
10
11
12
13
14
15
16
17
18
19
20
21
22
23
24
25
26
27
28
29
30
31
32
33
34
35
36
37
38
39
40
41
42
43
44
45
46
47
# security_hub_finding.py
import boto3
import json
from datetime import datetime

securityhub = boto3.client("securityhub")

def handler(event, context):
    """Convert Prometheus/Grafana alert to Security Hub finding."""
    alert = json.loads(event["body"])

    severity_map = {
        "critical": {"Label": "CRITICAL", "Normalized": 90},
        "warning": {"Label": "HIGH", "Normalized": 70},
        "info": {"Label": "MEDIUM", "Normalized": 40},
    }

    for alert_item in alert.get("alerts", []):
        severity = severity_map.get(
            alert_item["labels"].get("severity", "info"),
            {"Label": "MEDIUM", "Normalized": 40}
        )

        finding = {
            "SchemaVersion": "2018-10-08",
            "Id": f"otel-security/{alert_item['labels']['alertname']}/{alert_item['startsAt']}",
            "ProductArn": f"arn:aws:securityhub:{context.invoked_function_arn.split(':')[3]}:{context.invoked_function_arn.split(':')[4]}:product/{context.invoked_function_arn.split(':')[4]}/default",
            "GeneratorId": "opentelemetry-security-observability",
            "AwsAccountId": context.invoked_function_arn.split(":")[4],
            "Types": ["Software and Configuration Checks/Vulnerabilities"],
            "CreatedAt": alert_item["startsAt"],
            "UpdatedAt": datetime.utcnow().isoformat() + "Z",
            "Severity": severity,
            "Title": alert_item["annotations"].get("summary", alert_item["labels"]["alertname"]),
            "Description": alert_item["annotations"].get("description", "Security alert from OTel pipeline"),
            "Resources": [
                {
                    "Type": "Other",
                    "Id": alert_item["labels"].get("service_name", "unknown"),
                    "Region": context.invoked_function_arn.split(":")[3]
                }
            ],
        }

        securityhub.batch_import_findings(Findings=[finding])

    return {"statusCode": 200, "body": "Findings imported"}
Implementation Roadmap
Phase 1: Foundation (Week 1-2)
- Deploy ADOT Collector on EKS as a centralized Deployment
- Configure dual-export to CloudWatch/X-Ray and Amazon Managed Prometheus
- Instrument authentication endpoints with security span attributes
- Verify telemetry flow end-to-end
Phase 2: Security Instrumentation (Week 3-4)
- Add OTel instrumentation to all API gateways and authentication services
- Implement authorization event tracking
- Deploy ADOT Lambda layer for serverless workloads
- Create baseline security metrics (auth failure rate, API error rate, payload sizes)
Phase 3: Dashboards and Alerting (Week 5-6)
- Deploy Grafana on ECS Fargate (or enable Amazon Managed Grafana)
- Import security dashboard JSON configurations
- Configure Prometheus alerting rules for authentication and API security
- Connect Grafana Alerting to SNS and Slack for incident notification
Phase 4: Advanced Detection (Week 7-8)
- Implement impossible travel detection rules
- Add data exfiltration monitoring via payload size anomaly detection
- Create Security Hub integration for centralized finding management
- Build investigation workflows in Grafana Explore for trace-to-log correlation
Related Articles
- Real-Time Intrusion Detection Using AWS GuardDuty – Pair GuardDuty findings with OTel traces for context-rich threat detection
- AWS Lambda Security: Automated Threat Detection – Extend Lambda security with ADOT instrumentation for deeper observability
- AWS Cloud Security Best Practices Implementation Guide – Foundation security controls that feed into your observability pipeline
Conclusion
Security observability is not optional – it is the difference between detecting a breach in hours versus months. OpenTelemetry provides the vendor-neutral foundation, ADOT gives you production-ready AWS integration, and Grafana delivers the visualization layer your security team actually wants to use.
The approach outlined in this article – ADOT as the universal collector, dual-exporting to both AWS-native services and open source backends – gives you the best of both worlds. You keep CloudWatch integration for native AWS alarms and compliance. You gain Grafana for the advanced dashboards, correlation, and alerting that security operations demand. And you maintain the freedom to move your telemetry pipeline to any cloud or on-prem environment without rewriting a single line of instrumentation.
Start with authentication instrumentation. It is the highest-signal security telemetry you can collect, and the ADOT Collector makes it trivial to route to multiple backends. From there, expand to API behavior tracking, authorization monitoring, and the advanced detection patterns covered in this guide.
The observability gap in security is closing. OpenTelemetry is the open standard making it happen, and AWS is all in with ADOT. The question is not whether to adopt it – it is how quickly you can get your security telemetry flowing.
For hands-on guidance implementing security observability with OpenTelemetry on AWS, connect with me on LinkedIn. I regularly share DevSecOps strategies, AWS security patterns, and open source tooling recommendations.